Dashboard
Welcome to your very own dashboard. There is not much here when you first start but fear not... given a few ads, categories and time, it will spring up to life.
Overview
When you first arrive you'll have an empty dashboard with some help to get you started. Here is a quick overview of what to expect:
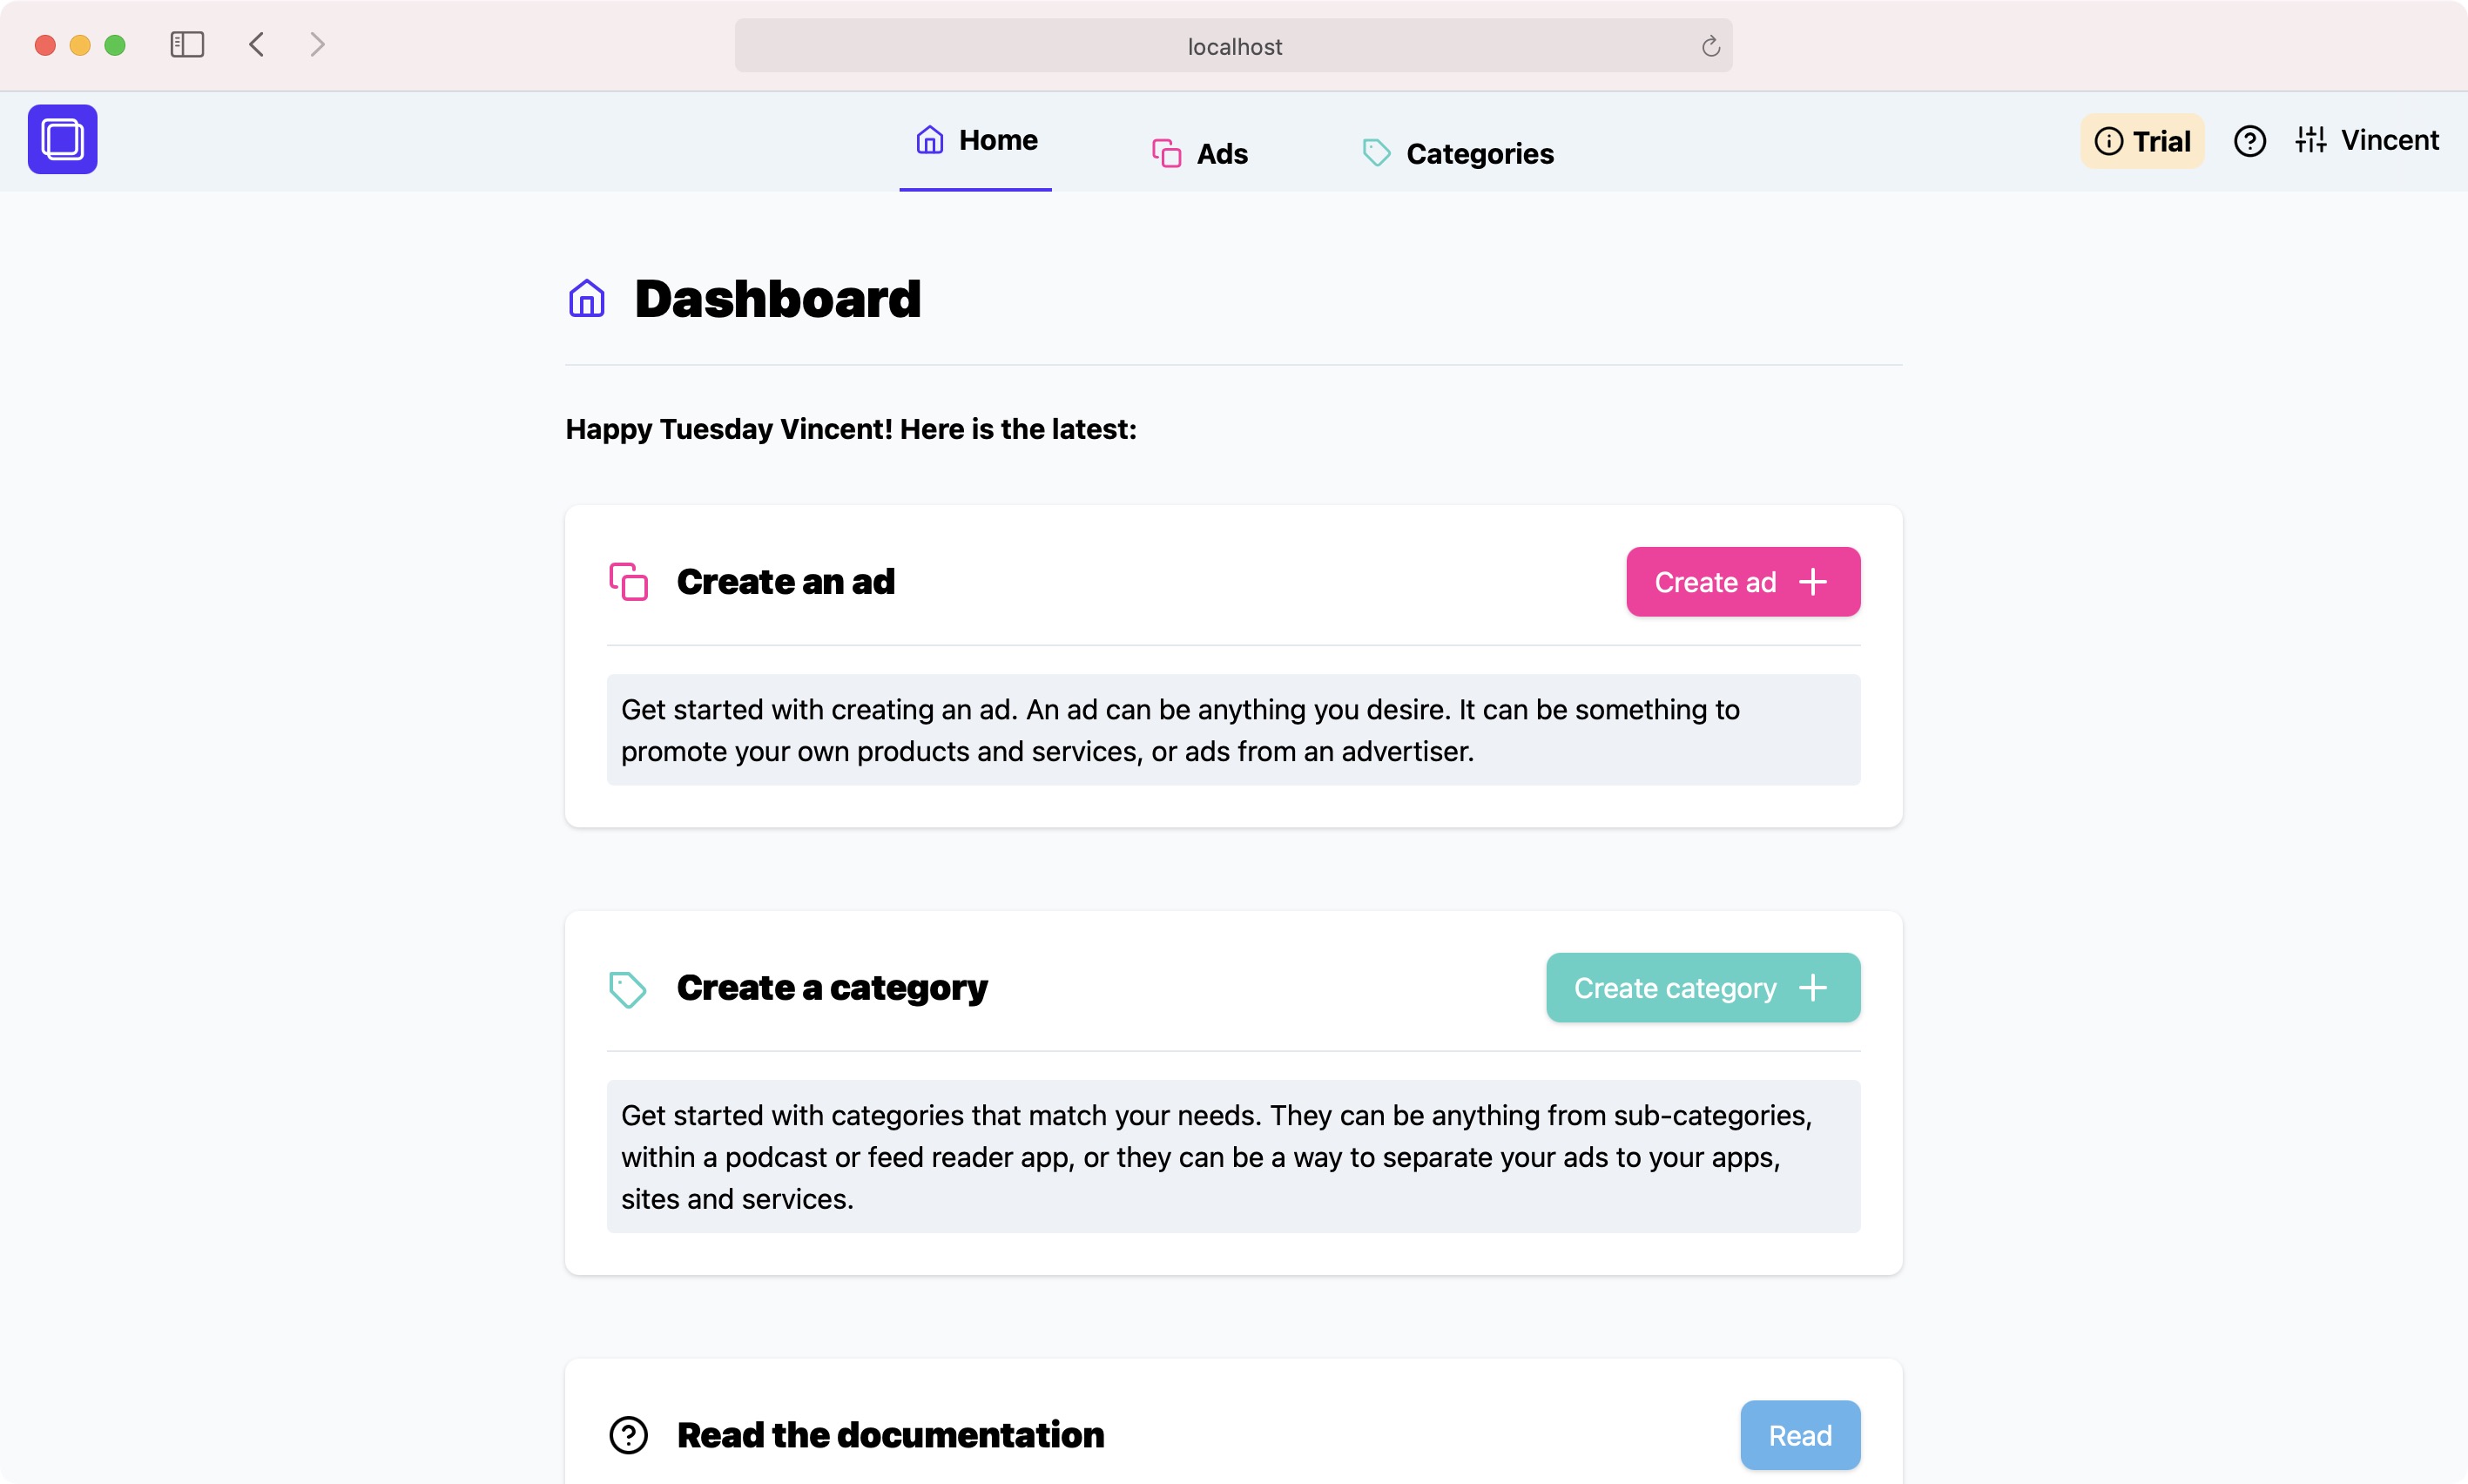
You'll see the following sections to get started:
- Ads
- Categories
- Documentation
Each section gives you a little bit of text to help you along. Documentation will link to these guides that you are reading right now (or so I hope... you're reading them, right?).
Stats
Once you're all set up and have some recorded taps under your belt, you'll see a nice graph giving you information on how you're doing. It's simple enough, but let's go through it.
Graph & stats
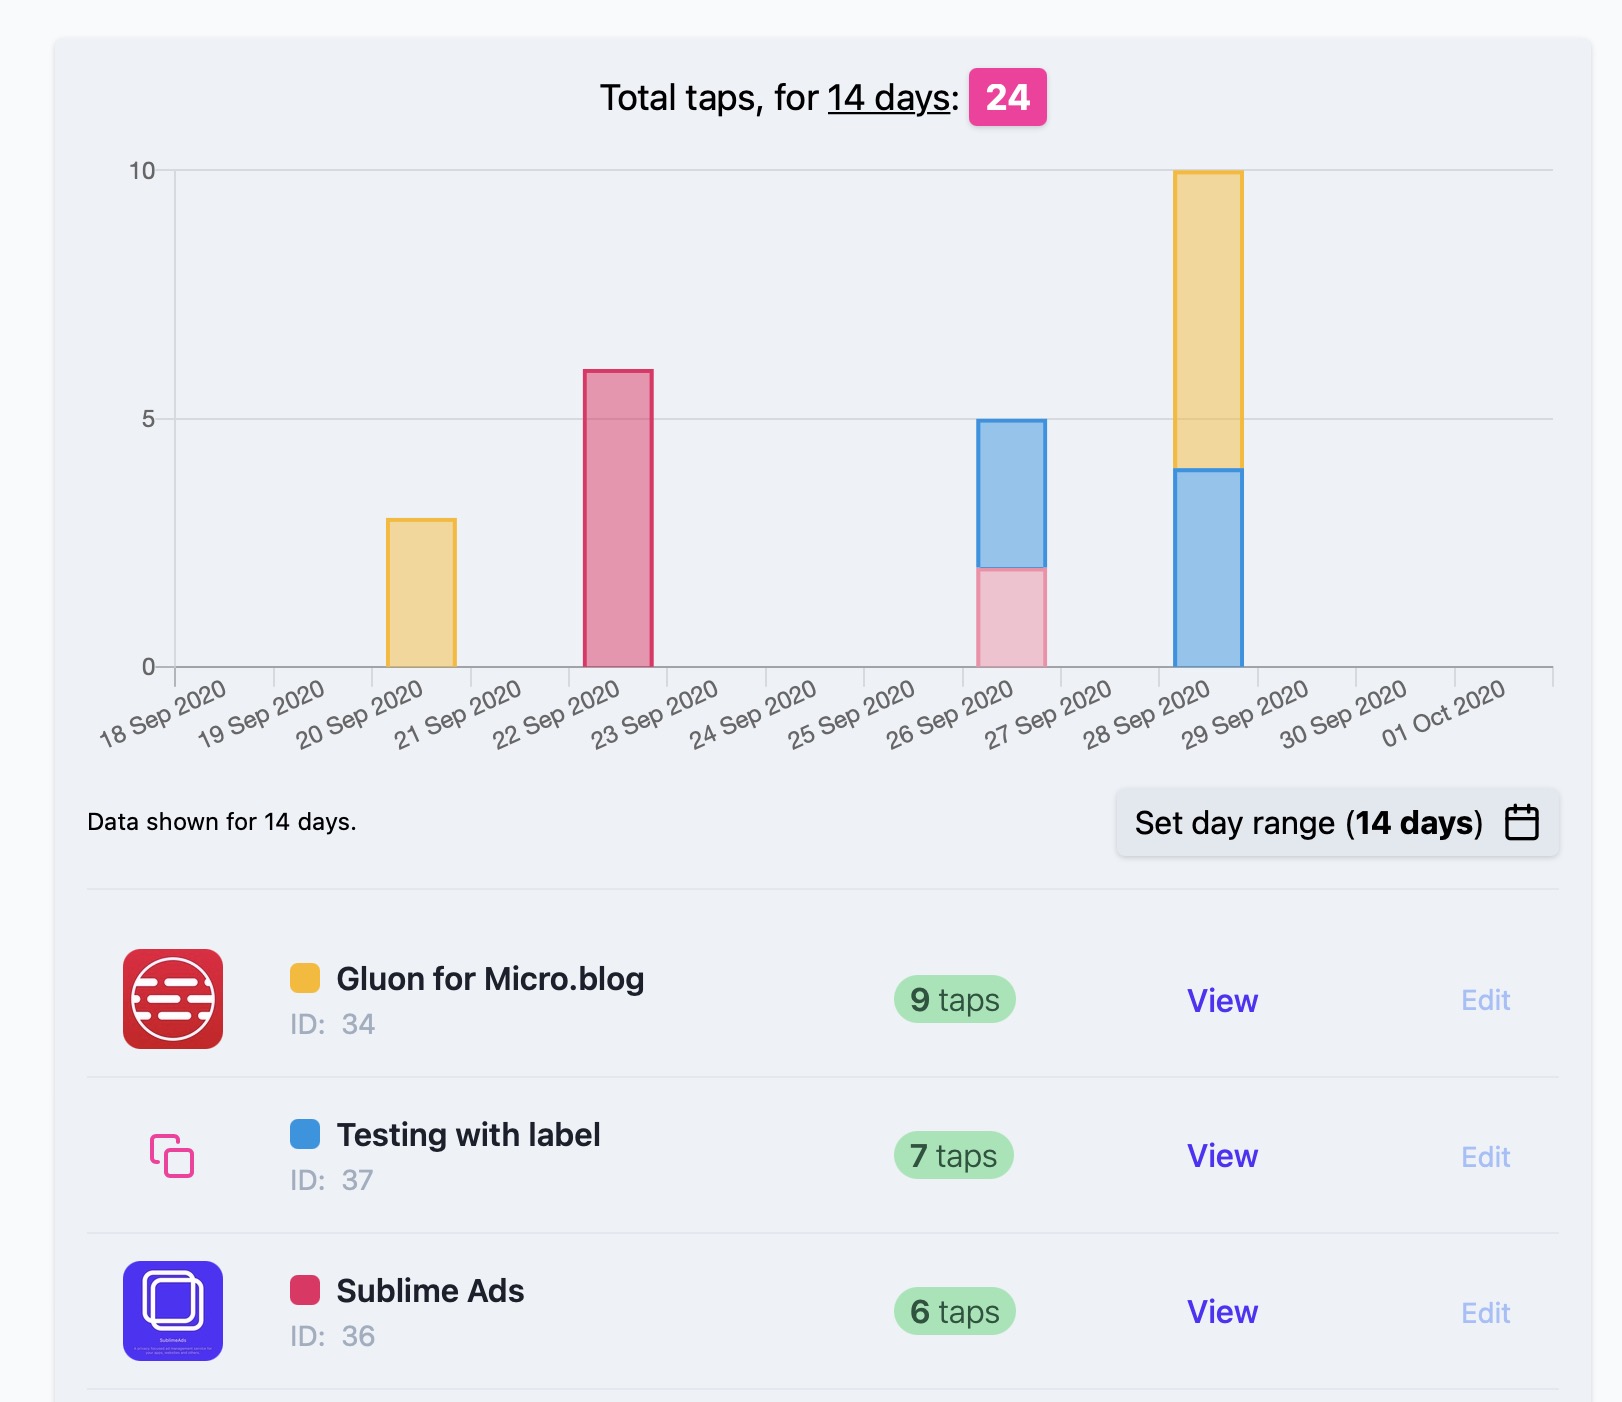
Above you can see the colourful stats section found on the dashboard. It's pretty simple. Note that this is just test data for the purpose of documentation.
You'll see your taps in the given time range (default of the past 7 days). The graphs are colour coded to the ad, so you can easily identify them. Just hover over a graph to see which ad it is. Don't worry, you can always change the label colour for an ad when creating or editing it at a later stage.
Below the graph you'll see a small breakdown of the most popular ads shown in the graph, with the highest taps always shown first.
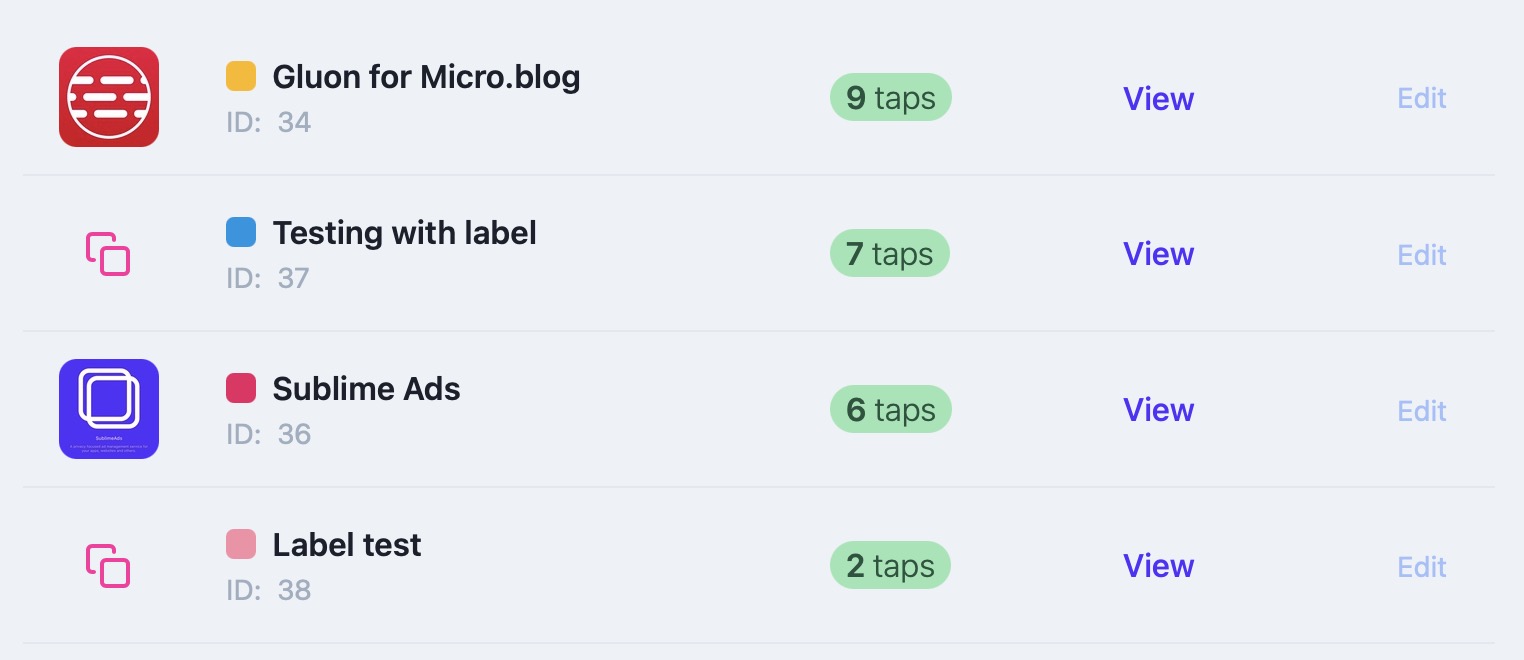
If you look at the line items, you'll see the name and label colour, including how many taps it received in the given time range.
Date filter
The graph contains a simple date range picker. For ease this just gives us a quick selection of predefined days.
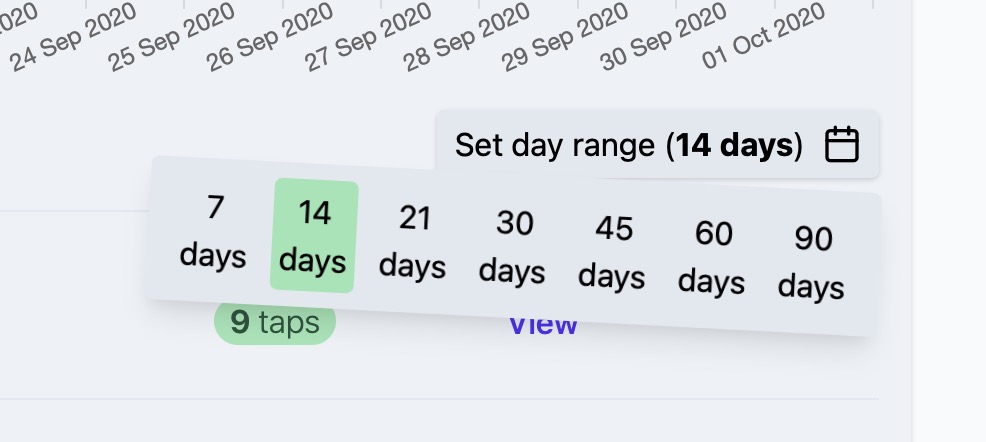
Just click/tap on any of the predefined dates to change your date range. Your preference will be saved to your browser storage, so when you look at other graphs they'll have the same date range.
Custom date ranges
Custom date ranges are in the works and will be implemented at a later time. If it's important to you, feel free to get in touch so I work on it sooner than later.
Filter by Views or Taps
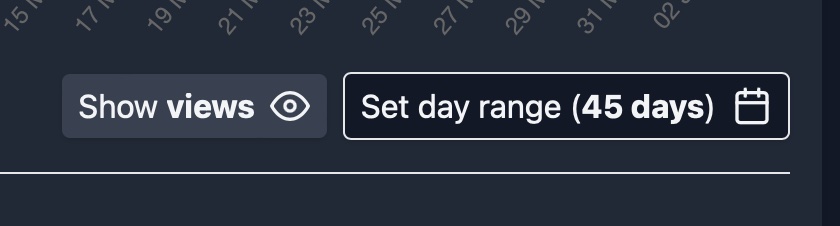
You can switch between viewing total taps or total views by using the toggle next to the date picker.
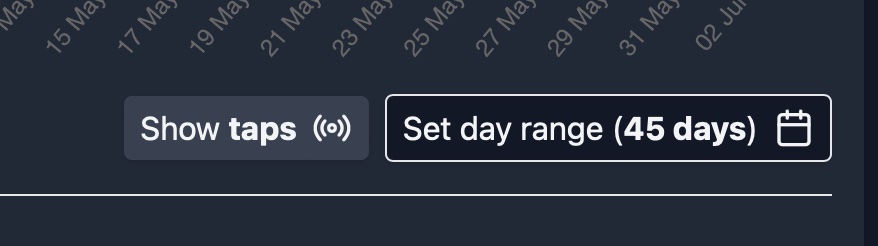
Tapping on Show Taps will display total taps in the data. When you're in the taps view mode, the button will change to allow you to toggle to Show Views:
Future versions
The dashboard is simple on purpose. However, future versions may included a few extras that I haven't thought about. If there is anything important you want to see, just get in touch.